
[Cross-posted with Statistics and Biodemography Research Group blog.]
The age-specific estimates of fatality rates for Covid-19 produced by Riou et al. in Bern have gotten a lot of attention:
| 0-9 | 10-19 | 20-29 | 30-39 | 40-49 | 50-59 | 60-69 | 70-79 | 80+ | Total |
| .094 | .22 | .91 | 1.8 | 4.0 | 13 | 46 | 98 | 180 | 16 |
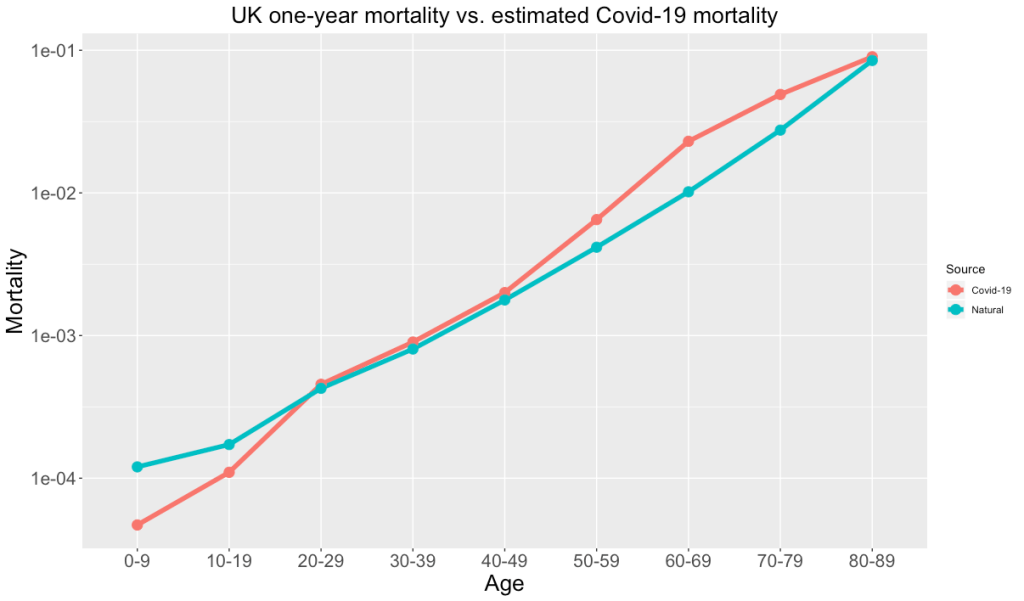
These numbers looked somewhat familiar to me, having just lectured a course on life tables and survival analysis. Recent one-year mortality rates in the UK are in the table below:
| 0-9 | 10-19 | 20-29 | 30-39 | 40-49 | 50-59 | 60-69 | 70-79 | 80-89 | |
| .012 | .17 | .43 | .80 | 1.8 | 4.2 | 10 | 28 | 85 |
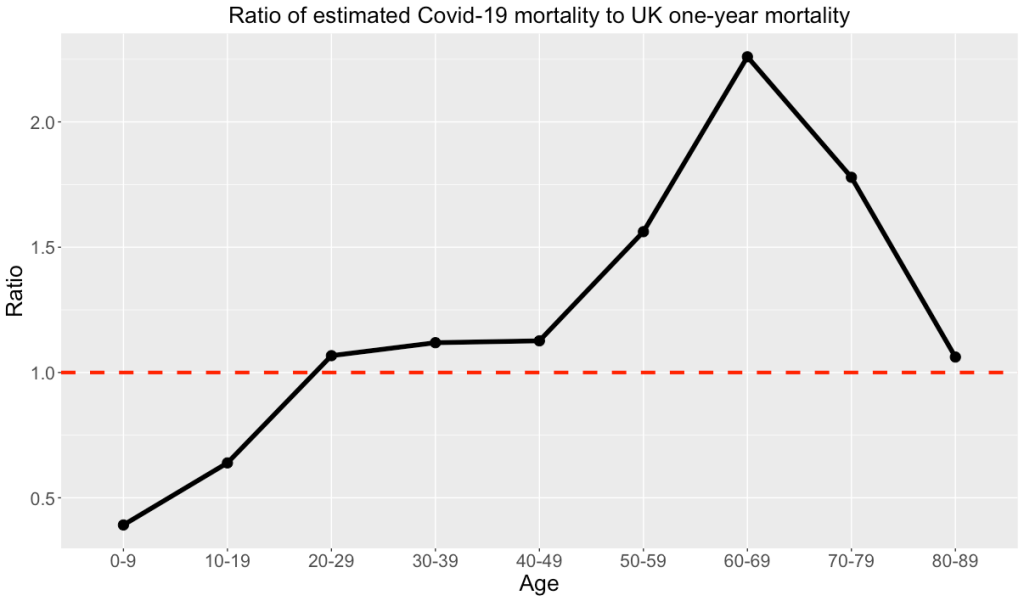
Depending on how you look at it, the Covid-19 mortality is shifted by a decade, or about double the usual one-year mortality probability for an average UK resident (corresponding to the fact that mortality rates double about every 9 years). If you accept the estimates that around half of the population in most of the world will eventually be infected, and if these mortality rates remain unchanged, this means that effectively everyone will get a double dose of mortality risk this year. Somewhat lower (as may be seen in the plots below) for the younger folk, whereas the over-50s get more like a triple dose.

2 thoughts on “Putting Covid-19 mortality into context”