After writing in praise of the honesty and accuracy of fivethirtyeight’s results, I felt uncomfortable about the asymmetry in the way I’d treated Democrats and Republicans in the evaluation. In the plots I made, low-probability Democratic predictions that went wrong pop out on the left-hand side, whereas low-probability Republican predictions that went wrong would get buried in the smooth glide down to zero on the right-hand side. So I decided, what I’m really interested in are all low-probability predictions, and I should treat them symmetrically.
For each district there is a predicted loser (PL), with probability smaller than 1/2. In about one third of the districts the PL was assigned a probability of 0. The expected number of PLs (EPL) who would win is simply the sum of all the predicted win probabilities that are smaller than 1/2. (Where multiple candidates from the same party are in the race, I’ve combined them.) The 538 EPL was 21.85. The actual number of winning PLs was 13.
What I am testing is whether 538 made enough wrong predictions. This is the opposite of the usual evaluation, which gives points for getting predictions right. But when measured by their own predictions, the number of districts that went the opposite of the way they said was a lot lower than they said it would be. That is prima facie evidence that the PL win probabilities were being padded somewhat. To be more precise, under the 538 model the number of winning PLs should be approximately Poisson distributed with parameter 21.85, meaning that the probability of only 13 PLs winning is 0.030. Which is kind of low, but still pretty impressive, given all the complications of the prediction game.
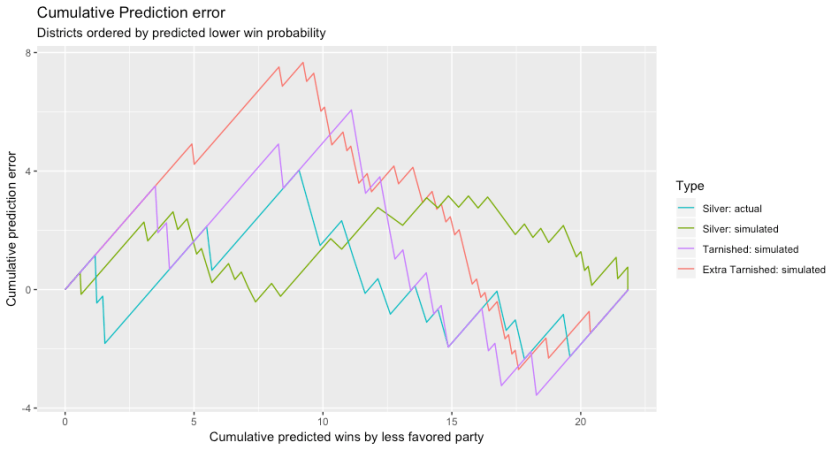
Below I show plots of the errors for various scenarios, measuring the cumulative error for these symmetric low predictions. (I’ve added an “Extra Tarnished” scenario, with the transformation based on the even more extreme beta(.25,.25).) I show it first without adjusting for the total number of predicted winning PLs:

We see that tarnished predictions predict a lot more PL victories than we actually see. The actual predictions are just slightly more than you should expect, but suspiciously one-sided — that is, all in the direction of over predicting PL victories, consistent with padding the margins slightly, erring in the direction of claiming uncertainty.
And here is an image more like the ones I had before, where all the predictions are normalised to correspond to the same number of predicted wins: